Description
The area of focus in this study is mainly Arizona, due to data richness and availability. Monsoon rains in Arizona usually start abruptly in early July and last until September. This strong precipitation pulse comprises the majority of precipitation in the region. It also influences the region’s energy budget in terms of flux partitioning. The question that arises naturally is – how does the change in energy fluxes influence and propagate into the atmospheric boundary layer? Furthermore, can it influence the intensity and frequency of subsequent precipitation? The best way to measure and analyze local energy fluxes is through flux tower data. However, before the aforementioned questions can be answered, the data quality should be tested.
Preliminary Results
Presentations
- Flux Tower Data Quality_Climate Feedback in Arizona, May 26
- Updated presentation: Flux Tower Data in Arizona, July 14
- Oct 28th: Estimating evapotranspiration in the North American Monsoon region by Dea Doklestic
- Nov 11th
- 2011 Mar 24: Monitoring Land Surface Drought by Dea Doklestic
Useful Links
- Quality check by Dea Doklestic. 2010
- Dominguez et al. 2008. Precipitation Recycling Variability and Ecoclimatological Stability-A Study Using NARR Data. Part II: North American Monsoon Region. American Meteorological Society. 15: 5187-5203.
- Mendez-Barroso et al. 2009. Seasonal and interannual relations between precipitation, surface soil moisture and vegetation dynamics in the North American monsoon region. Journal of Hydrology. 377: 59-70.
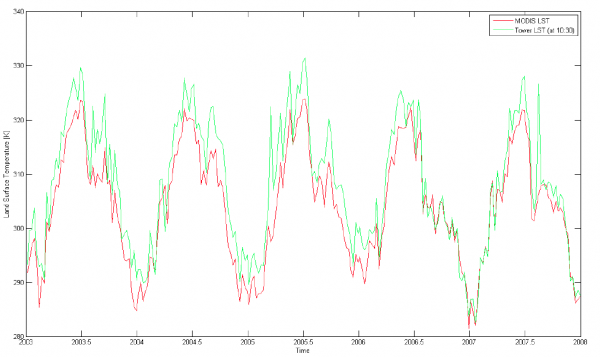
Land Surface Temperature Comparison
